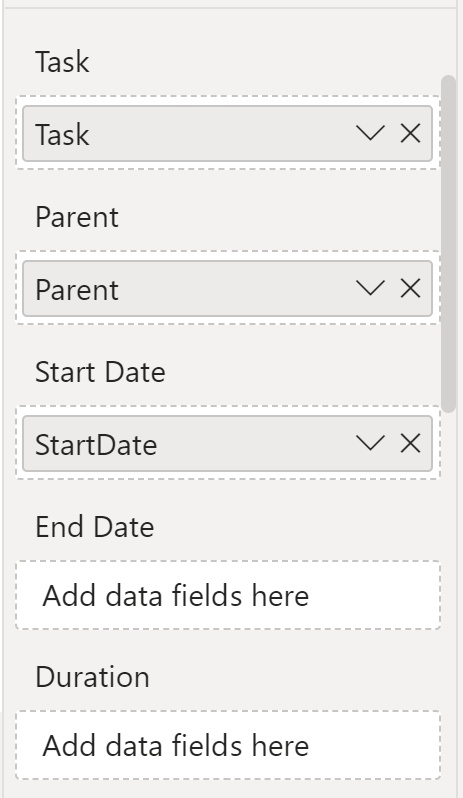
On a project recently, I wanted to use Microsoft’s Gantt chart visual for Microsoft Power BI. Try as I might, I couldn’t get the visual to accept an end date or duration. I could drag a column from the data model over to the field box for End Date or Duration but the field would not “drop” into the field box. Instead, when I’d let go of the mouse button, the box would stay empty.
I built a small test Power BI report + dataset from scratch, and the Gantt chart visual worked fine—no problems with configuring it by dragging and dropping fields.
Why wouldn’t this Gantt visual work with my existing Power BI report, but work just fine with the test report?
Continue reading
